Contents:
- What is presented in the statistics on companies?
- How to filter statistics on companies?
- How to download a statistics report?
In this section, it is possible to analyze reviews in the context of locations:
-
Which companies have problems (the ratings are low, the sentiment of the reviews is bad, there are few answers)?
-
Where do employees pay more attention to reviews and vice versa?
-
Which companies are more likely to leave reviews with a positive/negative/undefined/neutral sentiment?
-
How has the number of reviews changed in the last 3 months?
To go to the Locations page in the menu, click on Reputation Analytics and select Locations from the dropdown list.
The Locations page will open.
Attention! The page will display the results for the last 30 days before yesterday by default. That is, if today is May 23, the last available data will be for May 21. You can set other period using filters, see the details here.
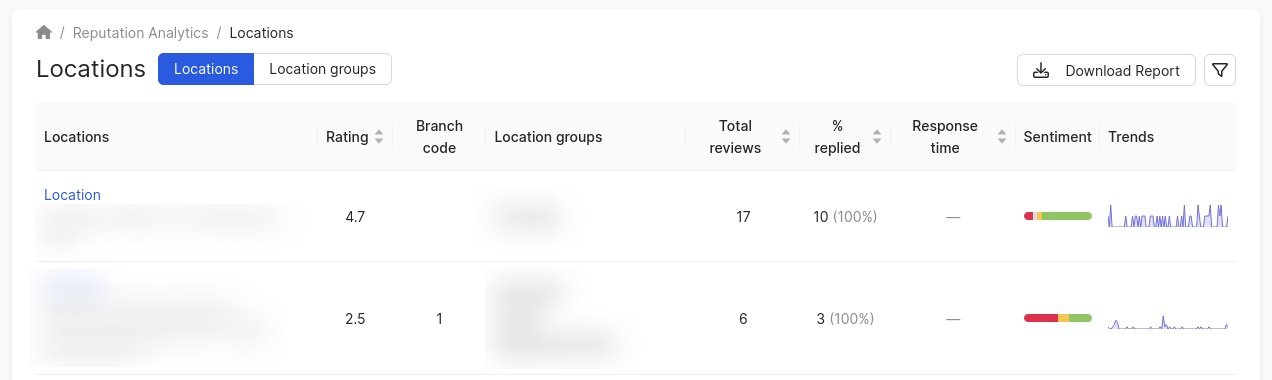
What is presented in the statistics on companies?
Statistics on companies are given in the form of a table, which presents:
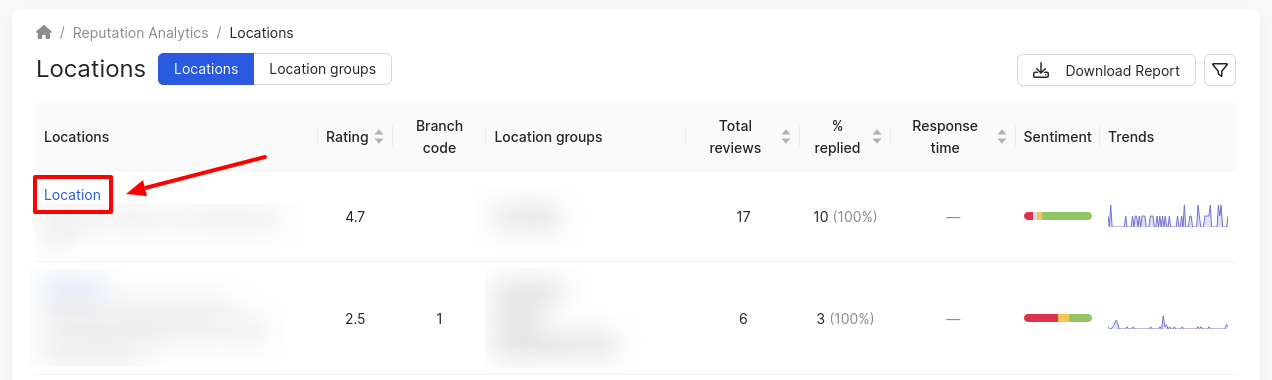
-
Location names. When clicking on the company name, the Reviews section filtered by that company in the top filter will open. You can learn more about it here.
- Location rating.
- Branch code.
- Location groups.
- Total reviews.
- % replied - the share of responses to reviews. The formula for calculation is as follows: number of reviews with responses / (total number of reviews - number of reviews that cannot be responded to) * 100.
Example:- Total number of reviews - 856.
- Number of reviews that cannot be responded to - 303.
- Reviews with responses - 403.
- Then: 403 / (856 - 303) * 100 = 73%.
- Response time is the average response time in the personal account. Attention! The average response time is calculated based on the reviews within the selected period.
It is calculated as follows: sum of response times to the company's reviews in the personal account / number of responses from the company.
Response time in the personal account is calculated as follows: time of response creation in the personal account - time of review creation in the personal account.
Example:- Sum of response times to the company's reviews in the personal account - 23750.
- Number of responses to the company's reviews - 10.
- Average response time: 23750 / 10 = 2375.
-
Sentiment.
-
Trends.
The Trends shows a graph in which you can see the growth and decline in the number of reviews left on the relevant company for each day of the last three months.
-
The x-axis shows the days for the period.
-
On the y-axis - the number of reviews left for the company specified in the field for the period.
Attention! If you decide to calculate the average rating across all companies, it will differ from the value shown on the main page of the Reputation Analytics section (see details here). This happens because by simply averaging company ratings, you are effectively calculating an average of averages, which is incorrect.
To calculate the average rating correctly, use the following formula: sum (company average rating * number of reviews) / total number of reviews.
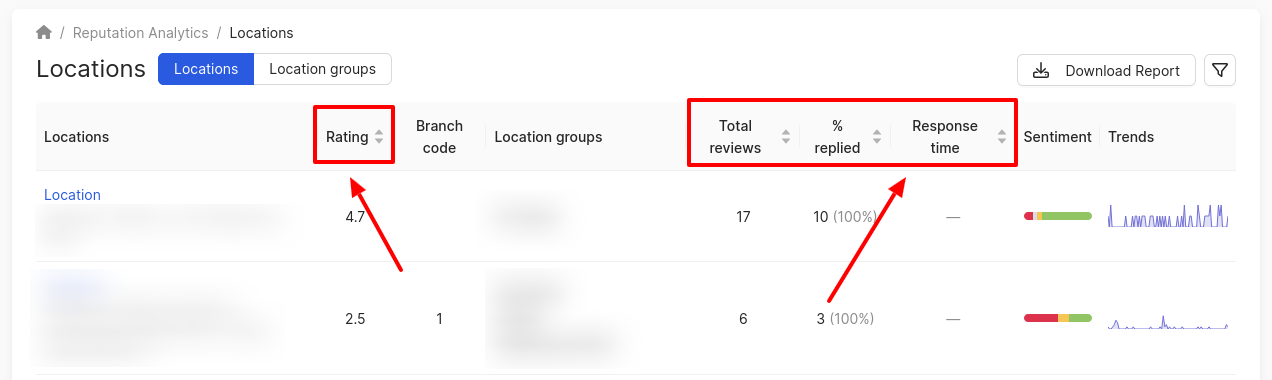
How to filter statistics on companies?
You can filter cities by ascending/descending order of rating, number of reviews, reviews with responses, response time.
- To sort in ascending order, click on the field: Rating/Reviews total/With answer/Response delay.
- To sort in descending order, click on the field twice.
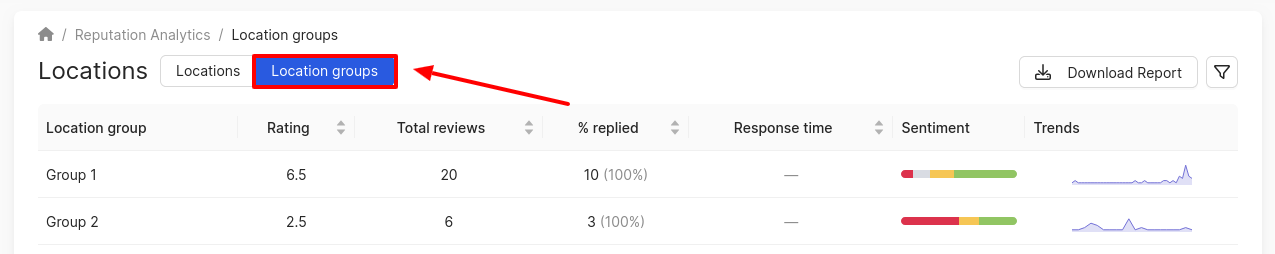
Additionally, you can view statistics on the locations broken down by groups of companies on the page.
To filter statistics on companies, click on the Filter icon in the upper right corner of the page.
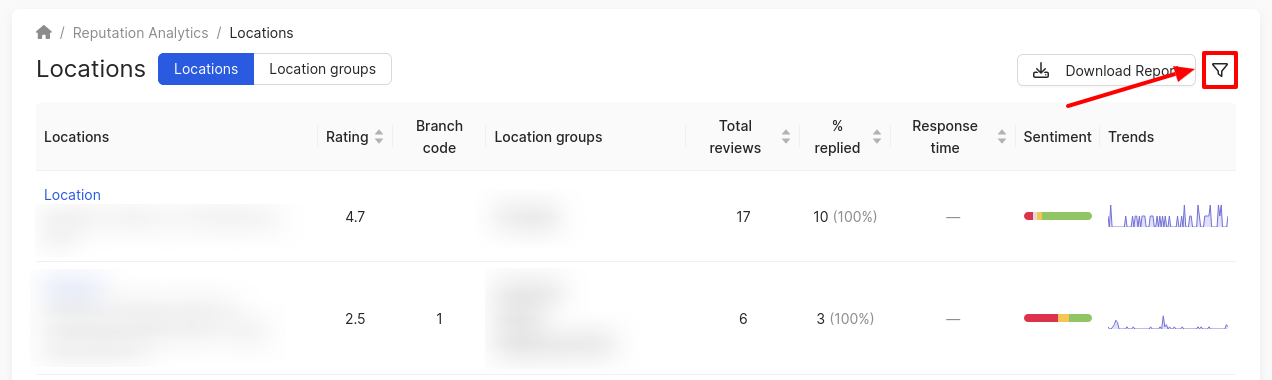
The Filters window opens on the right.
Information on setting up filters can be found here.
How to download a statistics report?
To download the report, click on the corresponding button in the top right corner of the page.
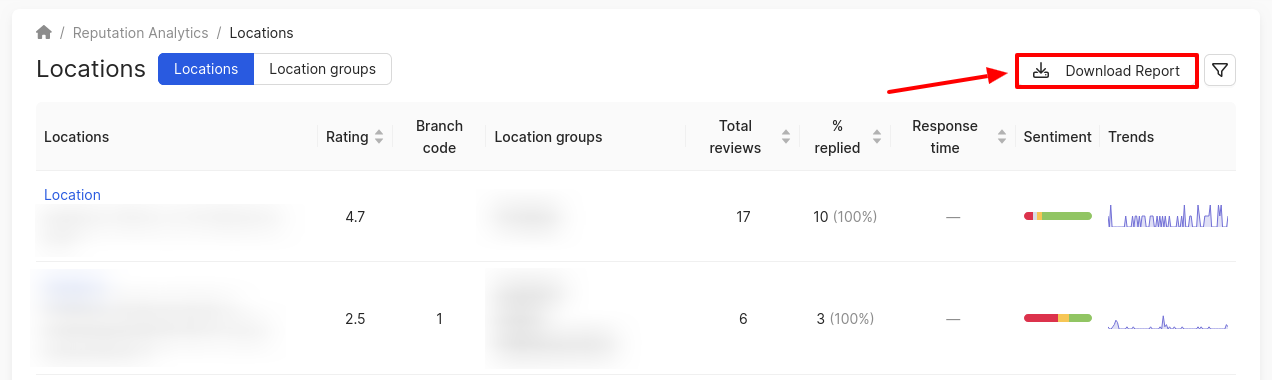
A window will open where you can select the report format:
- PDF.
- Excel.
If necessary, you can change the name of the downloaded file or leave it as default. Then click on Download.
Attention! When exporting reviews, the selected filters will be applied.
You can learn more about the User tags section further.