Contents:
In this section, you have the opportunity to analyze reviews based on the most popular words they contain and the topics they relate to, as well as find out:
- What are customers dissatisfied with and most concerned about (prices, assortment, large/ small selection, etc.)?
- What should be improved in the service?
- Which reviews should be paid more attention to (with which words or topics reviews have a bad rating and sentiment)?
- Has the problem been solved/has the problem appeared or not (in the Trends column, you can see whether the number of reviews with this topic has increased or decreased)?
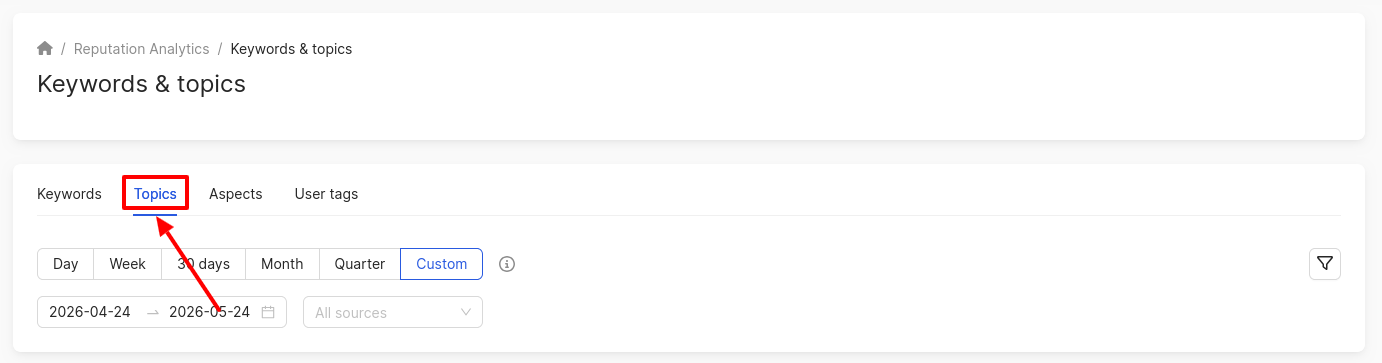
To navigate to the section in the menu, click on Reputation Analytics and select Keywords & Topics.
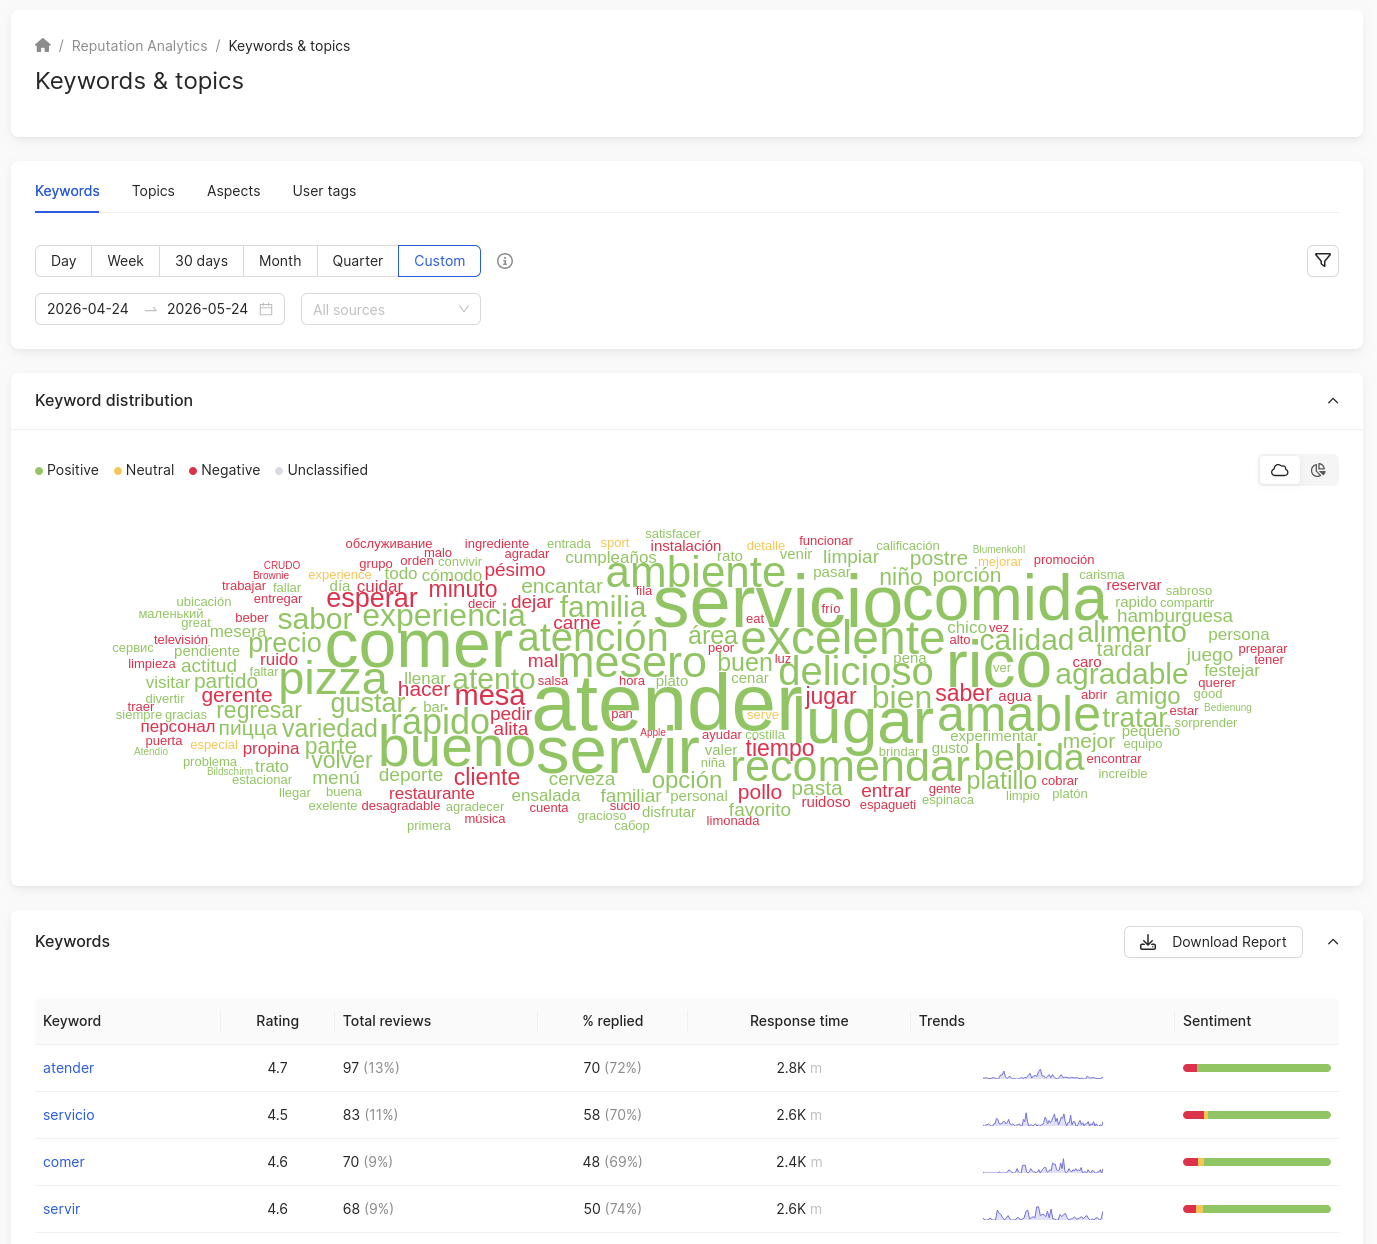
The Keywords & Topics page will open.
Attention! By default, the page will display the results for the last 30 days before yesterday. That is, if today is May 23, the last available data will be for May 21.
How to filter statistics by keywords and topics?
The filters described below are available on the Keywords & Topics page and the View Topic page.
All analytics on the page is provided based on the period set in the calendar:
- You can choose standard periods: day, week, 30 days, month, quarter.
- You can set a custom period by selecting dates in the calendar.
Attention! Analytics provides data excluding the current and previous days. This approach allows for more accurate analysis and comparison of data based on stable and established metrics, excluding the influence of recent changes.
You can also filter the data by catalogs.
Only on the View Topic page, you can choose details by:
- Days.
- Weeks.
- Months.
After setting this filter, data in the Dynamics of the number of reviews and Average rating dynamics charts will be displayed by day/week/month, respectively.
You can use the side filter by clicking on the filter icon. More information about it can be found here.
Keywords
First, the distribution of keywords by sentiment will be presented. The same cloud is also presented on the main page of the review analysis. You can learn more here.
To view the diagram with the distribution of main words, click on the corresponding icon in the upper right corner.
The graph will display the top 5 words (provided they exist) that were mentioned most frequently in the reviews. Each word corresponds to its own color on the diagram. The rest will be displayed in gray. Next is a table with words and the number of reviews associated with them.
Further, statistics on words are displayed. It is presented in the form of a table, which includes:
- List of all keywords.
- Average rating of reviews on which the keyword is placed.
- Total reviews.
- % replied.
- Average response time.
- Trends.
- Sentiment.
The Trends shows a graph in which you can see the growth and decline in the number of reviews with the corresponding tag word for each day of the last three months.
- The x-axis shows the days for the period.
- The y-axis shows the number of reviews with the tag word specified in the field for the period.
When you click on any keyword, the Search in reviews page opens. You can read more about this page here.
How to download a report by keywords?
To export the keyword statistics in .xlsx format, click the Download report button.
A window will open where you can, if desired, change the name of the exported file or leave the default. Then click Download.
Attention! When exporting keywords, the selected filters will be applied.
The resulting report includes the following fields:
- Keyword.
- Rating — the average rating of reviews mentioning this word.
- Number of reviews — the total reviews where the keyword was mentioned.
- Reviews with reply — the number of reviews containing a reply and mentioning the keyword.
- Response time in minutes — the average response time for reviews mentioning the keyword.
- Sentiment: Positive — the number of reviews with a positive sentiment mentioning this word.
- Sentiment: Neutral — the number of reviews with a neutral sentiment mentioning this word.
- Sentiment: Negative — the number of reviews with a negative sentiment mentioning this word.
- Sentiment: Not defined — the number of reviews with an undefined sentiment mentioning this word.
Topics
To view statistics by topic, click on the corresponding field.
Attention! By default, the page will display the results for the last 30 days before yesterday. That is, if today is May 23, the last available data will be for May 21.
If your company has not yet created any topics, 5 topics will be displayed by default:
- Product. Will be created if there are words such as quality, product, selection, assortment, empty, high-quality in the reviews about the company.
- Service. Will be created if there are words such as service, delivery, courier, queue in the reviews about the company.
- Store. Will be created if there are words such as website, store in the reviews about the company.
- Staff. Will be created if there are words such as employee, staff, seller in the reviews about the company.
- Cost. Will be created if there are words such as cost, price, discount in the reviews about the company.
Attention! If there are no reviews containing the default topic keywords, they will not be displayed in the section. As soon as you receive a review containing any of the keywords, a topic will be created.
Statistics on topics are given in the form of a table, which presents:
- Name of the topic.
- Average rating of the reviews on this topic.
- Total reviews.
- % replied.
- Average response time to reviews.
- Sentiment.
- Trends.
- Actions.
Attention! You can edit and delete only the topic that was created by you.
The Trends column shows a graph in which you can see the growth and decline in the number of reviews left on the relevant topic for each day of the last three months.
- The x-axis shows the days for the period.
- The y-axis shows the number of reviews left on the topic specified in the field for the period.
How to create/edit a topic?
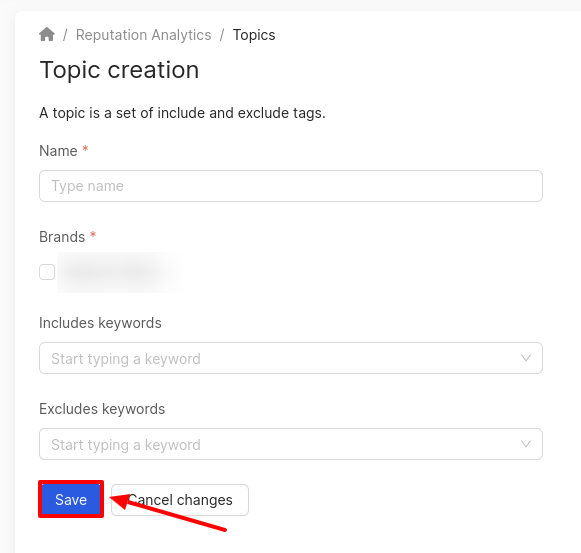
To add a new topic, click on Create topic. To modify an existing topic, click on the edit icon.
The Topic creation/edition page will open. The topic consists of a set of inclusive and exclusive tags. Fields marked with asterisk (*) are mandatory.
In the first field, enter or modify the name of the theme.
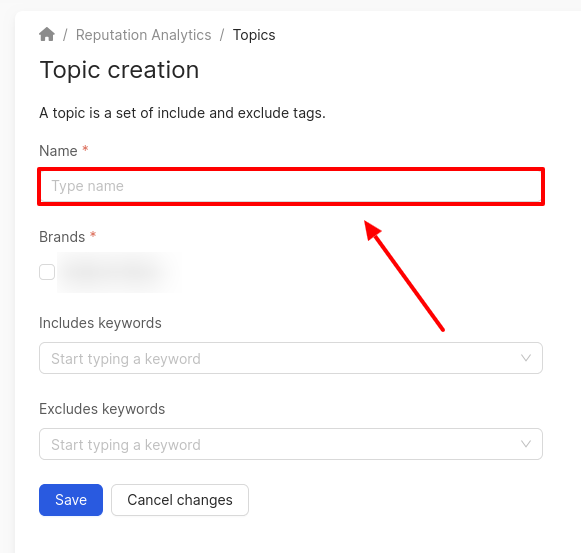
Then select the brand to which reviews related to this topic will apply.
In the Includes keywords/Excludes keywords fields, you can specify, accordingly:
- Keywords that must be included in reviews for grouping on this topic.
- Keywords that must be excluded from reviews for grouping on this topic.
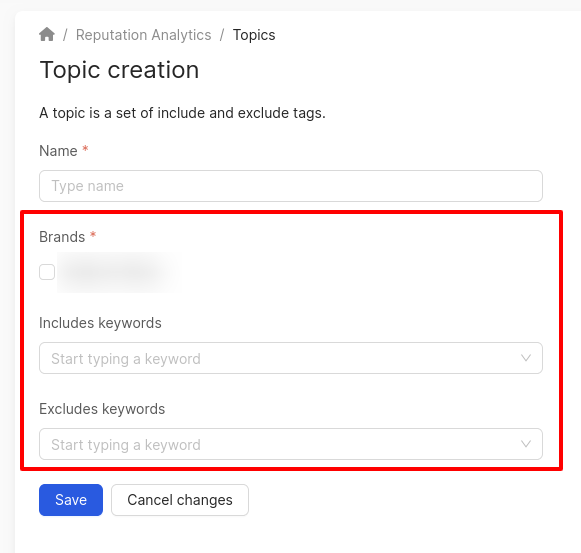
To save the topic, click on the corresponding button.
Attention! It may take some time for the topic to appear in the list and for statistics to be displayed for it.
How to delete a topic?
To delete the theme, click on the Delete icon.
Attention! You can delete only those topics that have been created by you.
How to download a report by topics?
To download the report, click on the corresponding button in the top right corner of the page.
A window will open where you can select the report format:
- PDF.
- Excel.
If necessary, you can change the name of the downloaded file or leave it as default. Then click on Download.
Attention! When exporting reviews, the selected filters will be applied.
How to go to the detailed view of the topic section?
Attention! Viewing is available only for topics that you have created yourself.
To go to the detailed view of a topic, click on the necessary one.
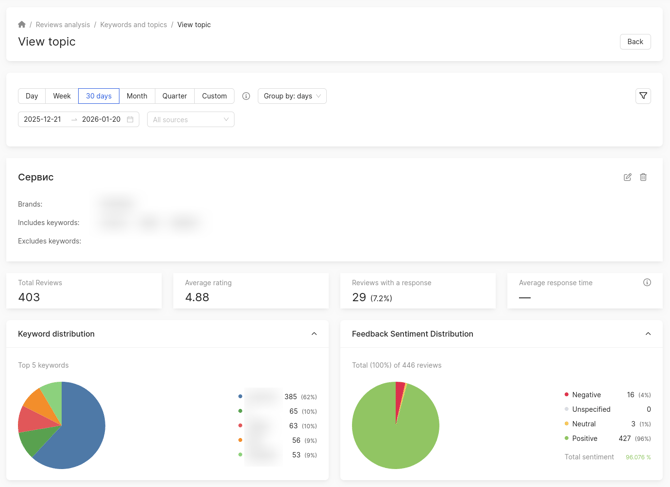
The View Topic page will open, displaying the following information:
- Our tags. This block contains the name of the theme, words that it includes and excludes. You can also edit and delete the theme here.
- Total reviews — the number of reviews related to this theme.
- Average rating of reviews for this theme.
- Reviews with a responses — the number and proportion of responses to reviews.
- Average response time to reviews.
- Keywords distribution that are most frequently mentioned in reviews for this theme.
- Feedback sentiment distribution of reviews. The chart displays:
- Number of positive reviews (shown in green).
- Number of negative reviews (shown in red).
- Number of indeterminate reviews (shown in gray).
- Number of neutral reviews (shown in yellow).
There are trained models for analyzing sentiment distribution. The accuracy of sentiment distribution is over 80%. In the center of the diagram general sentiment is shown:
- If the general sentiment is indicated from 0% to 49%, it means that the negative sentiment prevails in the reviews.
- If the general sentiment is indicated from 51% to 100%, it means that the positive sentiment prevails in the reviews.
- If the sentiment tends to 50%, the neutral sentiment prevails in the reviews.
The next block shows the dynamics of the average rating of reviews related to the topic:
- The x-axis displays the days for the selected period.
- The y-axis displays the average rating of reviews.
To find out the average rating of reviews on a specific day of the period, hover your mouse over the point on the graph.
Next, you can find out the dynamics of the number of reviews related to this topic:
- The x-axis displays the days for the selected period.
- The y-axis displays the number of reviews.
To find out how many reviews were posted on a specific day of the period, hover your mouse over that point on the graph.
Information on the Locations page can be found further.