![logo2.png]](https://help.brandwizard.io/hs-fs/hubfs/logo2.png?height=40&name=logo2.png)
In this article, you will learn about the following information:
- How to set a period for displaying charts and comparing data?
- Tone index dynamics by aspects
- List of aspects
- Tone index
Aspects in reviews are specific features, topics, or elements of a product/service that are mentioned in the review text. They enable a more precise understanding of what the user liked or disliked. Aspects are stored as automatic tags.
- Identifying the strengths and weaknesses of a product or service based on the sentiment index dynamics for specific aspects (for example, "Service," "Parking").
- Quickly monitoring changes in sentiment for individual aspects over time, as well as assessing the impact of promotional campaigns or process changes.
- Comparing aspects with your own and competitor companies to understand which areas require improvement or adjustment.
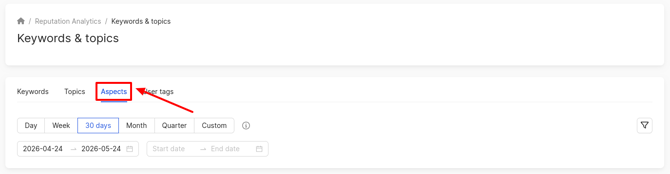
To access the analysis of aspects, in the menu, click Reputation Analytics and select Keywords & Topics.
Then, click on the Aspects section.
How to set a period for displaying charts and comparing data?
All analytics on the page are provided depending on the period set in the calendar:
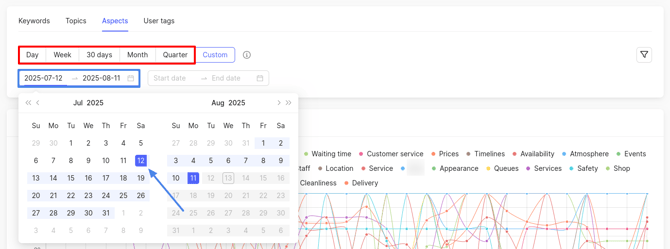
- You can choose standard periods: day, week, 30 days, month, quarter
- You can specify a custom period by selecting dates in the calendar
Attention! The analytics provides data excluding the current and previous days. This approach allows for more accurate analysis and comparison based on stable and established metrics, excluding the influence of recent changes.
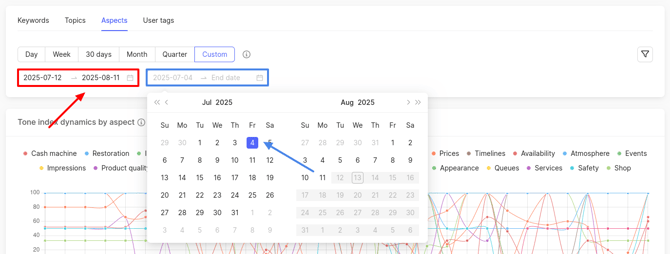
You can also compare periods. To do this, first select the desired period in the first calendar field, then in the other field, select another period.
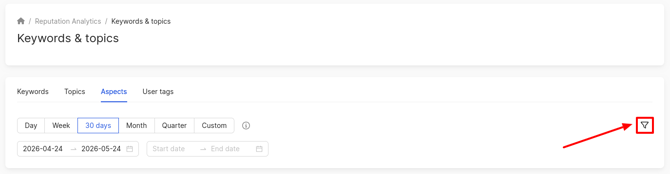
You can use the side filter by clicking on the filter icon. More information about it can be found here.
Tone index dynamics by aspects
The sentiment index is a metric that reflects the difference between the share of positive and negative reviews. It is calculated as follows:
(Number of positive messages / Total messages) * 100 minus (Number of negative messages / Total messages) * 100
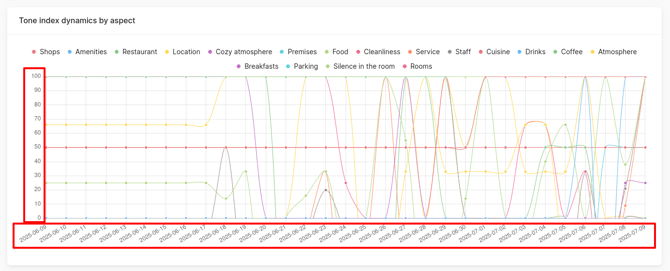
Above the chart, there is a list of aspects marked with different colors. The chart displays the dynamics of the sentiment index change for each aspect over the selected period:
- Along the x-axis — dates of the period.
- Along the y-axis — sentiment index value.
List of aspects
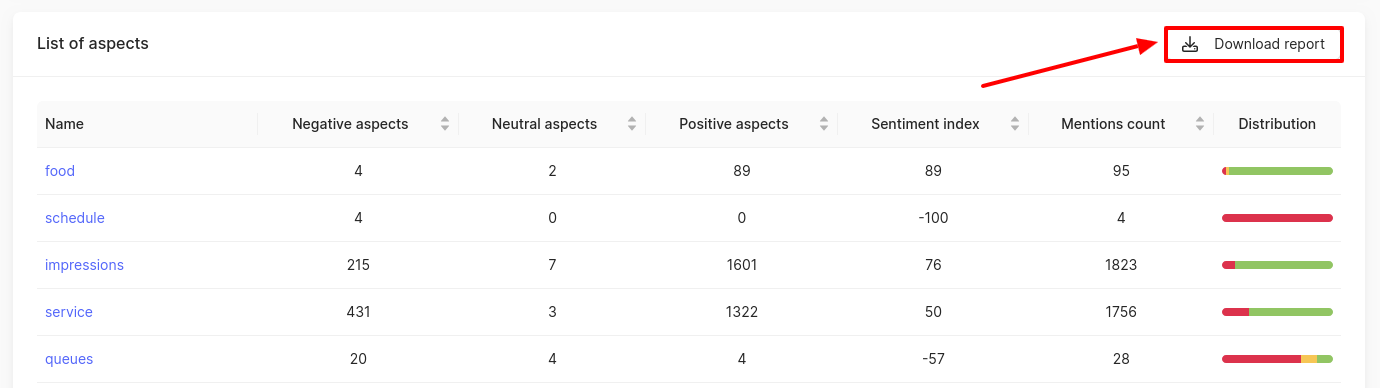
This block provides the ability to analyze:
- The number of aspects broken down by Negative, Neutral, and Positive.
- Sentiment Index – an indicator that reflects the difference between the share of positive and negative aspects. It is calculated as follows: (Number of positive aspects / Total number of aspects) × 100 – (Number of negative aspects / Total number of aspects) × 100.
- Mentions count – the total number of aspects.
- Distribution – the sentiment distribution of aspects. You can see which aspects prevail: positive, negative, or neutral.
This data helps identify areas that need improvement or adjustment. Each column can be sorted in ascending or descending order, making it easier to compare and identify priority aspects.
Clicking on an aspect name opens the Reviews section, filtered by that aspect.
This list of aspects can be downloaded in .xlsx format. The requested report will be sent to your email.
Tone index
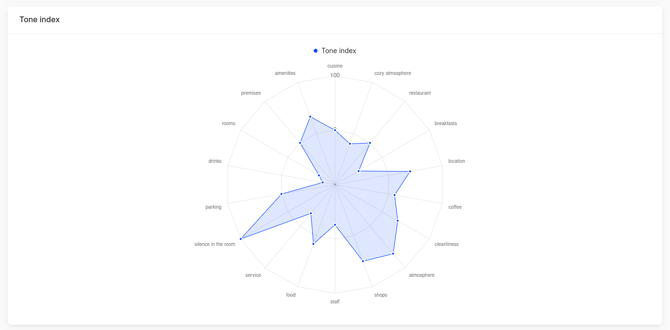
The tone index is an indicator that reflects the difference between the share of positive and negative reviews. It is calculated as follows: (N positive messages / N total messages) * 100 - (N negative messages / N total messages) * 100
This chart allows for comparing the sentiment index between aspects, visually highlighting areas where improvements are needed. Such analysis helps to focus efforts on aspects with more negative sentiments, increasing overall customer satisfaction.
You can learn more about the competitor comparison further.