In this article, you will get acquainted with the following information:
- Basic terms
- Distribution of reviews by country and region
- Review text
- Sentiment distribution
- Sentiment over time
- Word stats
- Review publication times
- Distribution of reviews by source
- Top 5 topics
- Top 5 companies
- Top 5 tags
- Top 5 aspects
- Comprehensive comparison of reviews
- How to download the review analysis report?
This section presents graphs with quantitative indicators for reviews, with the help of which it is possible to conduct a detailed analysis and understand what needs to be improved in the company to increase the rating, increase customer loyalty and improve reputation.
On the Reputation Analytics page you can:
- See how many reviews have come, is it much or little?
- See how the company’s reputation is changing.
- What are the users talking about in the reviews?
- What sites give the largest number of reviews, and which have reputation problems?
- What locations are "the best", and what are "the worst"?
- Analyze frequently occurring words in reviews, evaluate trends.
- Understand which topics are the most popular.
- Monitor changes in reviews by topics important to the company.
- Compare quantitative indicators of reviews with competitors.
- See what users write in the reviews of competitors, what hurts their customers.
Basic terms
Tone / Sentiment Analysis is a task of computational linguistics, which consists in determining the emotional coloring (tonality) of the text and, in particular, in identifying the emotional assessment of the authors in relation to the objects described in the text. Values: Positive, Neutral, Negative, Undefined.
Trend - a graph showing the trend of growth or decline, time is on the x-axis, and quantity is on the y-axis.
Topic - a grouping of reviews by topic. For instance, there are reviews of a restaurant that can be grouped by the following topics: cuisine, staff, drinks, etc.
To open the Reputation Analytics page, click on Reputation Analytics in the menu box, and select Dashboard from the drop-down list.
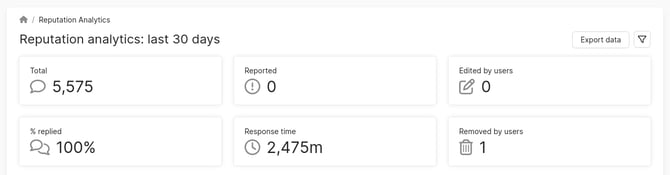
The Reputation Analytics page opens. In the header you can see:
- The total number of reviews.
- Reported — the number of reviews to which complaints and auto-complaints have been submitted.
- The number of reviews that have been changed by users.
- % replied - the share of responses to reviews. Attention! This value includes all responses to feedback for the selected period!
When calculating, reviews that cannot be answered are not taken into account. The formula for calculation is as follows: number of reviews with a response / (total number of reviews - number of reviews that cannot be answered) * 100.
Example:- Total number of reviews - 856.
- Number of reviews that cannot be answered - 303.
- Reviews with a response - 403.
- Then: 403 / (856 - 303) * 100 = 73%.
- Response time - this is the average response time in the personal account. It is calculated as follows: the sum of response times to reviews in the personal account divided by the number of responses.
Response time in the personal account is calculated as follows: the time of response creation in the personal account minus the time of review creation in the personal account.
Example:- Sum of response times to reviews in the personal account - 23750.
- Number of responses to reviews - 10.
- Average response time: 23750/10 = 2375.
- The number of reviews deleted by users. Attention! The page will display the results for the last 30 days before yesterday by default. That is, if today is May 23, the last available data will be for May 21.
Distribution of reviews by country and region
This section presents a map where you can analyze:
- In which regions do users leave more reviews about the company and vice versa?
- Where are there problems or need to improve the service (you can see the tone of reviews throughout the region)?
In this case, United Arab Emirates is represented on the map.
To the right of the map you will see the filter by country. If the company has locations in several countries, then you can select the necessary one in the filter.
Below is the total number of reviews left by users.
Attention! South Ossetia is not included in the map of Georgia. Therefore, if there are locations in this region, reviews will not be displayed on the map.
Attention! This block takes into account only reviews that are geo-referenced to a location:
- The numbers in the Total Reviews and the Total Number of Reviews fields may be different. This is due to the fact that the map does not display reviews from sites where the review is given to the brand as a whole, without reference to a specific location.
The region color on the map indicates the overall sentiment of reviews in that region:
- Red — indicates that negative sentiment dominates in the reviews.
- Yellow — indicates that neutral sentiment prevails in the reviews.
- Green — indicates that positive sentiment is predominant in the reviews.
The colors gradually shift from red to yellow, and then to green. The more saturated the color, the stronger the corresponding sentiment in the region.
When you hover the cursor over a region on the right side of the page, the number of reviews and the overall sentiment for that region will be displayed.
Review text
In this section, you can see the ratio of reviews with and without text. If the number without text is bigger, then it is worth stimulating users to leave a detailed response. The brighter and more relevant the content of reviews, the more useful they are and the more likely they are to find a response and push customers to buy.
In this section you will see a diagram with the following information:
- Share of reviews with text (displayed in dark color).
- Share of reviews without text (displayed in light color).
When hovering the mouse cursor over the chart, a window will display the number of reviews corresponding to one of the segments: With text or Rating-only.
Sentiment distribution
In this section, you can see the general impression of users about the company when viewing reviews. If the ratio of negative sentiment is greater, then it is worth paying attention to working with reviews, analyzing them and understanding what problems customers have and what can be improved in the service.
Attention! Sentiment is determined only based on reviews that contain text.
In this section you will see a diagram with the following information:
- Share of positive reviews (displayed in green color).
- Share of negative reviews (displayed in red color).
- Share of neutral reviews (displayed in gray color).
- Share of unclassified reviews (displayed in yellow color).
There are trained models for analyzing sentiment distribution. The accuracy of sentiment distribution is over 80%.
In the center of the diagram general sentiment is shown:
- If the general sentiment is indicated from 0% to 49%, it means that the negative sentiment prevails in the reviews.
- If the general sentiment is indicated from 51% to 100%, it means that the positive sentiment prevails in the reviews.
- If the sentiment tends to 50%, the neutral sentiment prevails in the reviews.
A minimum of 1 review (positive or neutral) is required to calculate the overall tone. The calculation of the overall tone is based on the following formula: (50 * (2 * number of positive reviews + number of neutral reviews))/(number of positive reviews + number of neutral reviews + number of negative reviews).
When hovering the mouse cursor over the chart, a window will display the number of reviews corresponding to one of the segments.
Sentiment over time
With the help of a graph, you can track the trend of the appearance of reviews, and what sentiment they have. You can quickly track whether there are more negative reviews, and whether the company has problems. It is necessary to strive to increase the number of positive reviews.
In the graph:
- x-axis - the dates for the selected period.
- y-axis - the number of reviews per day with sentiment distribution (positive, neutral, negative, unclassified).
On the graph you will see 4 sentiment categories:
- Green represents positive sentiment.
- Yellow represents neutral sentiment.
- Red represents negative sentiment.
- Gray represents unclassified sentiment.
To find out the exact number of reviews, their share, and sentiment (the number of negative, unclassified, neutral, and positive reviews) for a specific day, you need to hover the cursor over the column in the chart that corresponds to the selected day.
If you need to see the number of reviews for a different period, for instance, a week or month, click on Week or Month in the filter in the top right corner of the diagram.
Word stats
This section presents a cloud of the most popular words that are used in reviews. With the help of the cloud, you can understand:
- Which words are found in reviews more often than others (they will be displayed the largest and boldest)?
- What sentiment do reviews have in which tag words occur (if negative prevails, then you can roughly understand from the cloud what customers are not satisfied with, for instance, the product)?
The sentiment of reviews can be found by the color of the words in which they occur most often:
- Green represents positive sentiment.
- Yellow represents neutral sentiment.
- Red represents negative sentiment.
- Gray represents unclassified sentiment.
When you click on any tag word, the Search in Reviews page opens. You can read more about this page here.
To view tag statistics, click on Word stats in the bottom right corner of the section. You can find out more about this here.
Review publication times
In this chart, you can find out at what time of day and on which day of the week users most frequently leave reviews:
- The x-axis shows the time.
- The y-axis shows the number of reviews.
When you hover the mouse cursor over a column in the chart, a popup window will appear displaying the number of reviews left at a specific time on the selected day of the week over the past 30 days. You can also set a custom time period for which you need the review data. This can be done using the side filter. More details are provided here.
Distribution of reviews by source
In this section, you can understand:
- In which services do users leave reviews more often?
- In which catalogs do employees respond to reviews more often, which ones should be paid more attention to?
- Which sources are more likely to leave reviews with a positive/negative/undefined/neutral sentiment?
- How has the number of reviews changed in the last 3 months?
The information is presented in a table with the corresponding columns:
- Sources.
- Rating.
Attention! The rating in this section is rounded and differs from the rating on the Reviews page. - The number of reviews and their percentage in each source.
- The number of reviews with a response and their percentage in each source.
- Dynamics.
- Sentiment.
The Dynamics column shows a graph in which you can see the growth and decline in the number of reviews in the corresponding catalog for each day of the last three months.
- The x-axis shows the days for the period.
- The y-axis shows the number of reviews left on the company in this source.
Top 5 topics
This section presents the top 5 topics that appeared most frequently in reviews during the selected period. The table also shows the number of reviews for these topics, the average rating of such reviews, and the sentiment scale. With this statistics, you can understand:
- What does not suit customers and most of all they care about (prices, assortment, large/ small selection, etc.)?
- What needs to be improved in the service?
- Which reviews should be given more attention (with which topic do reviews have a bad rating and sentiment)?
A topic consists of keywords that customers mentioned in their reviews. If your company has not created any topics yet, 5 default topics will be displayed:
- Product. Will be created if there are words such as quality, product, selection, assortment, empty, high-quality in the reviews about the company.
- Service. Will be created if there are words such as service, delivery, courier, queue in the reviews about the company.
- Store. Will be created if there are words such as website, store in the reviews about the company.
- Staff. Will be created if there are words such as employee, staff, seller in the reviews about the company.
- Cost. Will be created if there are words such as cost, price, discount in the reviews about the company.
Attention! If there are no reviews containing the default topic keywords, they will not be displayed in the section. As soon as you receive a review containing any of the keywords, a topic will be created.
To view the list of all topics, as well as create and edit them, you need to click on Details in the bottom right corner of the section.
Top 5 companies
In this section, you can see the top 5 companies with the highest number of received reviews for the selected period. The table also displays the company ratings and the sentiment scale of the reviews.
For more detailed information about all companies, click on the Details button. You can learn more about this here.
Top 5 tags
This section displays the top 5 tags that appear most frequently in reviews. The statistics include only user-defined tags created in the Tags section. You can learn more about this here. The table also displays the number of reviews with these tags, the average rating of such reviews, and the sentiment scale.
To obtain more detailed information about all tags, you need to click the Details button. You can learn more about this here.
Top 5 aspects
Aspects in reviews are specific characteristics, topics, or elements of a product/service that are mentioned in the review text. They help to better understand exactly what the user liked or disliked. Aspects are stored as automatic tags.
The block shows the top 5 aspects most frequently mentioned in reviews. Additionally, the table presents the number of reviews for each aspect, the average rating of these reviews, and the sentiment scale.
To get more detailed information about all aspects, click the Details button. You can learn more about this here.
Comprehensive comparison of reviews
This diagram shows brands comparison by several factors:
- Number of reviews.
- Average rating.
- Response time.
- Number of reviews with an answer.
- Number of negative reviews.
- Number of positive reviews.
When you click on any brand, the unselected brand will be displayed on the chart. For instance, when you click on a competitor’s brand, your brand is displayed on the chart.
Under the diagram main indicators for comparison are shown:
- Brands.
- Rating — the average rating of companies over the selected period.
- Locations total.
- Reviews total — the total number of reviews left during the selected period.
- Reviews per location — the arithmetic mean of reviews left per location during the selected period.
- Replied reviews — the count of responded reviews during the selected period.
- Response delay — the average time taken to respond to reviews during the selected period.
- Sentiment — the review tone scale over the selected period.
- Tonality index — the difference between the proportions of positive and negative reviews. Calculated as: (number of positive reviews / total reviews) * 100 – (number of negative reviews / total reviews) * 100.
- NPS — the difference between the percentage of positive and negative reviews. In our case, it is calculated as: ((number of reviews with a rating ≥ 4.5) – (number of reviews with a rating from 1 to 3)) / total reviews.
- Top source — the source where the most reviews have been left.
How to download the review analysis report?
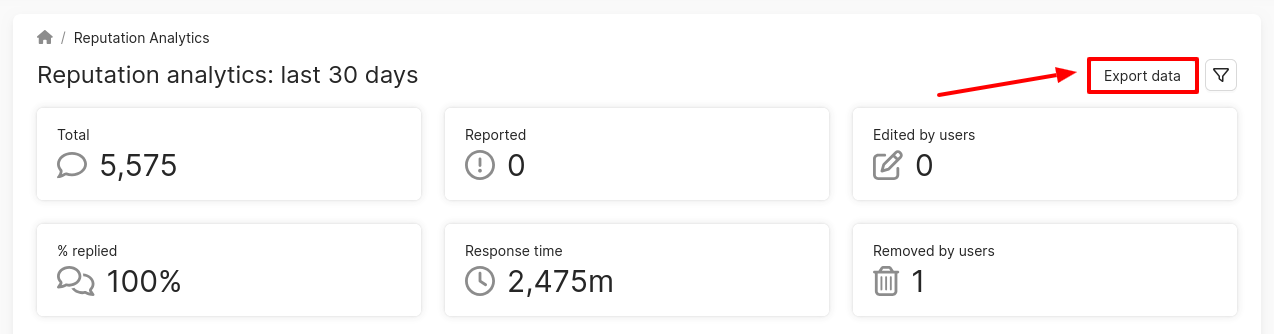
To save the reviews analysis in a pdf file,click on Export data in the Reputation Analytics page header.
The file stores all the information from the Reputation Analytics page, taking into account all the selected filters (i.e. you can filter the data in the report depending on the business task and download a pdf file containing only the data that is visible on the screen).
What filters are available on the Reputation Analytics page, you can find out further.