In this article, you will get acquainted with the following information:
In this section, you can analyze the online presence of the company to find out where it is necessary to edit or add information on the cards and in what way basic metrics changed after connection to BrandWizard.
At Presence Analytics page you can find:
- What is the percentage of synchronization and completeness of the cards?
- Which navigators are synchronized?
- How to set up a period you need to see the analytics for?
- How many impressions, site visits, calls, built routes and other target actions were performed in the selected period for all catalogs (Google, Yandex, 2GIS (URBI) and Facebook) for each individual catalog?
- What sources of transitions to Google and 2GIS (URBI) cards were used by the clients?
You can view the overall metrics of your online presence as well as those for each catalog (Google, Yandex, 2GIS (URBI), and Facebook) separately by navigating to the pages through the menu. Data will be displayed only for the catalogs you have access to.
If you have not yet purchased a license for this functionality, a page will open where you can activate a free trial period for 14 days. To do this, click on Try for free.

A window will open indicating the duration of the trial period. Click on Connect.
You can also purchase a license in the Plans & Limits section. More information about this can be found here. After the purchase, you will be able to access the section.
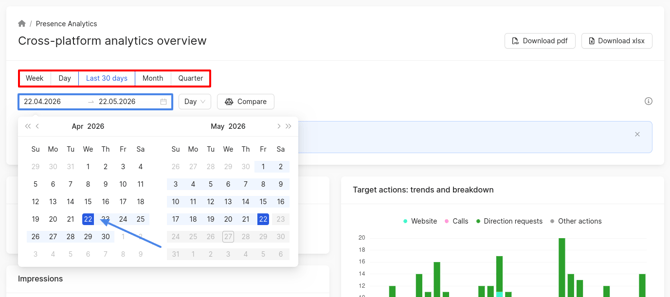
How to set the period for displaying graphs and data comparison?
All analytics on the online presence pages (for all catalogs and each separately) are provided depending on the period set in the calendar:
- You can choose standard periods: week, 30 days, month, quarter.
- You can specify a custom period by selecting dates in the calendar.
- You can set the data display step: by days, weeks, or months.
Attention! The data is displayed for the latest available 30 days by default. Analytics in the catalogs will be available in 5 days. E.g., if today is 16.02, the latest available data will be for 11.02.
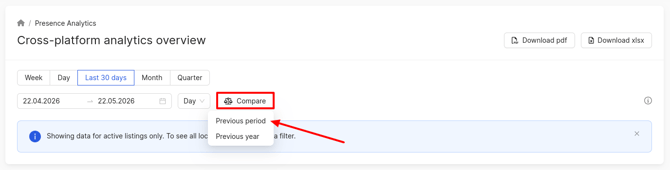
It is also possible to compare periods. To do this, click the button and select the period: previous year/period.
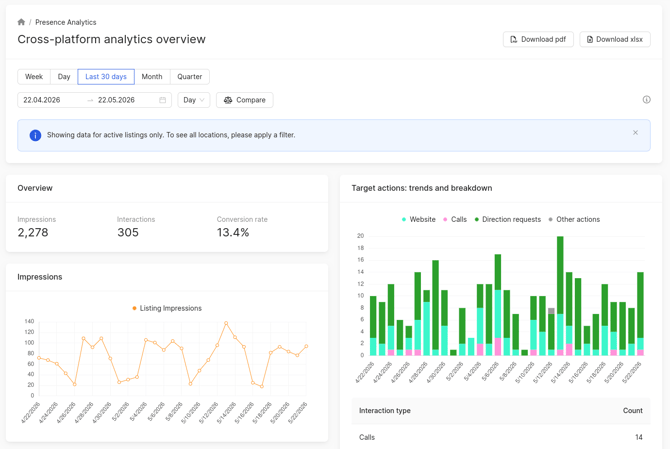
Overview
In Overview block of this section, you can find the following for all companies:
- The number of all impressions of the cards on the catalogs.
For the Google catalog, this field displays the sum of the following parameters:- Experiences (reviews and ratings left) about the company on Google Maps on desktop devices.
- Company impressions in Google Search on desktop devices.
- Company impressions in Google Maps on mobile devices.
- Company impressions in Google Search on mobile devices.
Attention! Several impressions by a unique user during one day are counted as one impression.
- Interactions: a number of searches for routes, calls, site visits, etc.
- Conversion rate: percentage of interactions to impressions.
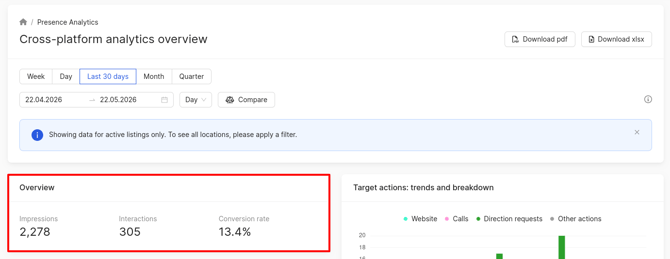
Target actions: trends and breakdown
Target actions: trends and breakdown block shows the graph, as well as summary of all calls, site visits, built routes and others (for example, number of bookings, food orders) for all companies per each day of the selected period.
To learn the exact number of site visits/calls/routes/others for a certain day, hover the cursor over the column in the diagram corresponding to the selected date.
The summary under the graph shows the number of site visits/calls/routes/others for the whole period. In the Other field for the Google catalog, the displayed metrics include the number of messages, bookings, food orders, or clicks related to viewing or interacting with menu content received in the business profile. Multiple clicks by a unique user within a single day are counted as a single action
For the 2GIS (URBI) catalog, in the Target actions: trends and breakdown block in the type of actions, in addition to the basic data found in the Overall perfomance section, the following will also be displayed:
- Calls to action.
- Social media clicks.
- Photos clicks.
For the Yandex catalog, in addition to the main data found in the Overall perfomance section, the field Clicks in stories (clicking the button within the history itself) will also be displayed in the actions type. Please note! The click statistics in stories available in your BrandWizard account may differ from the data in Yandex. This is because some companies that are present in Yandex may be missing from BrandWizard.
To make an interaction not appear on the graph, you should click on it.
For the Yandex directory, in addition to the main data, statistics on social networks will be displayed in the action type:
- Clicks to Telegram.
- Clicks to WeChat.
- Clicks to Viber.
- Clicks to WhatsApp.
Attention! If there is no data on social networks (i.e., the number of clicks = 0), this block will not be displayed.
To make an interaction not appear on the graph, you should click on it.
Impressions
Impressions block displays a graph with the total number of impressions for all companies per each day/week/month of the selected period.
To learn the exact number of impressions per certain day, hover the cursor over the dot on the graph corresponding to the selected date.
Engagement
This block is displayed only for the Yandex directory. It shows the statistics of user actions in company profiles on Yandex for all companies for each day of the selected period.
To get the exact number of actions for a specific day, hover the cursor over the corresponding column on the chart. The total number of actions for the entire period is displayed in the summary below the graph. To hide a specific action from the chart, click on its name above the graph.
- Data for the Yandex catalog is gathered in the personal account from Yandex.Metrica.
- If a click was made on a phone number in the listing, +1 is recorded for the Phone Clicks metric. If the user clicked on the phone number and immediately called, this counts as +1 for Phone Clicks and +1 for Calls from cards (this metric is displayed in the Target actions: trends and breakdown block).
- Entrance views refer to the number of times users in the organization’s card on Yandex Maps enabled the Show entries feature and viewed the entrance to the building where the business is located. This counts as a separate action (like phone clicks, reviews viewing, etc.) because entrances are marked on the map as individual objects.
- Direct transitions are visits to the site via a typed URL, a saved link, etc.
- Discovery in maps is counted when a user, not specifically searching for your organization, navigates to its listing during a search process.
Transitions are considered discovery if they occur:
- From search results on the maps: by type of organization, product, service, or address.
- From a similar organization’s listing.
- Directly from labels in Yandex.Maps, without searching, for example: a user opened the Yandex.Maps mobile app on their smartphone, saw a "Cinema" label in a nearby district, clicked on it, and went to that cinema’s listing.
Conversion sources for Google Business Profile listings
This diagram is presented only on the Google Business Profile analytics page. The color of its segments corresponds to a certain source of transition to the card on Google catalog for the selected period. Color distribution of sources is shown next to the diagram.
To see the number of transitions from a certain source, hover the cursor over the diagram segment corresponding to the color of the needed source.
In addition, the number of transitions from each source is shown in the summary below the diagram.
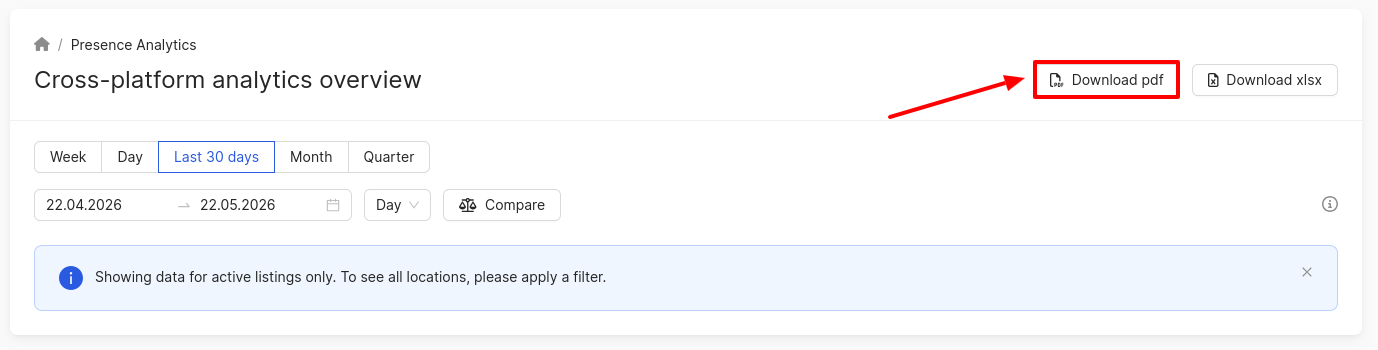
How to download analytics data?
On each page of the section, you can download data using the current filters by clicking on Download pdf. The report in pdf format will be downloaded immediately.
Only on the Cross-platform analytics overview page for all catalogs can you download reports for all pages of the section in .xlsx format. To do this, click on Download xlsx.
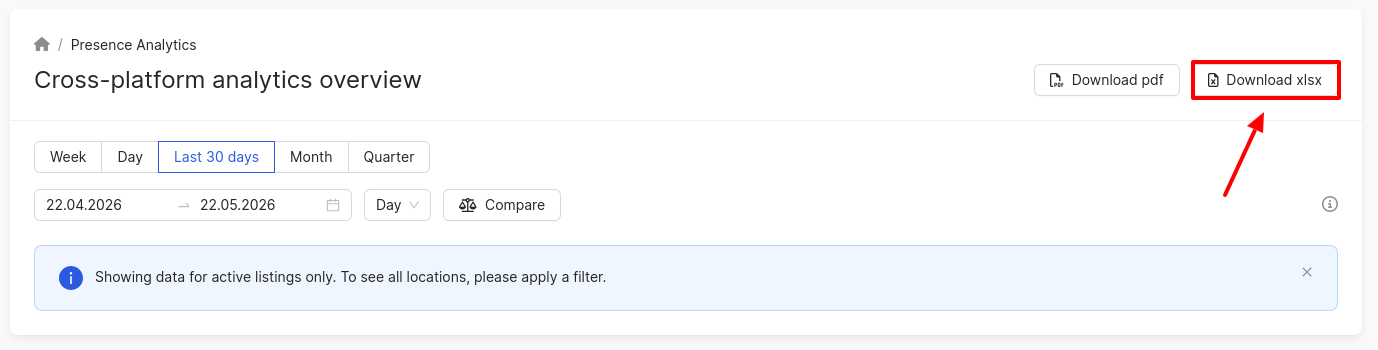
Clicking on it will open a window where you can select the pages for which the data will be exported. If it is necessary to send the report to someone else besides you, enter the additional email addresses in the Additional emails field, separated by commas. After that, click on Export. The information will be displayed according to the applied filters on the Cross-platform analytics overview page for all directories.
Attention! Data on search queries is collected for the past calendar month. In the first 8 days of the month, data for the previous month will be displayed in your personal account if it has not yet been collected for the previous month. That is, if today is the 1st-8th of October, and the data for September has not yet been collected, the results for August will be shown. Therefore, if you had set a filter for the period for which the queries have not yet been collected when downloading the data, they will not be displayed in the export.
You can learn more about Platform sync here.