In this article, you will get acquainted with the following information:
To navigate to the page, you need to click on Reputation Analytics in the menu and select Listing ratings from the dropdown list.
Attention!
-
The rating in the 2GIS (URBI) catalog may change over time in the absence of new reviews and ratings. This is because newer reviews have a greater weight in the rating calculation, while older ones gradually lose their influence.
-
If the rating on a company's card in Yandex, Google, or 2GIS (URBI) is 0 (not displayed), but there are reviews, then the Listing ratings section will show a rating calculated based on the reviews in our personal account, rather than from the catalog.
Key features for rating analysis
This page provides information on the changes in the ratings of company cards in the directories of Google Maps, Yandex Maps, and 2GIS (URBI).
The filtering and sorting mechanisms offer the following capabilities:
- Flexibly set periods for generating reports.
- View changes in card ratings over a period.
- View the overall dynamics of ratings over a period, with the ability to sort companies that have fallen, risen, or remained unchanged in the rating during the selected period.
- Download a report in .xlsx format for further detailed study or work in Excel.
Attention! The rating will be displayed if the company is linked to at least one of the catalogs (Yandex, Google, 2GIS (URBI)) and the location in that catalog has a rating. The rating is only shown from the moment the company is linked to the catalog; data from previous dates will not be available.
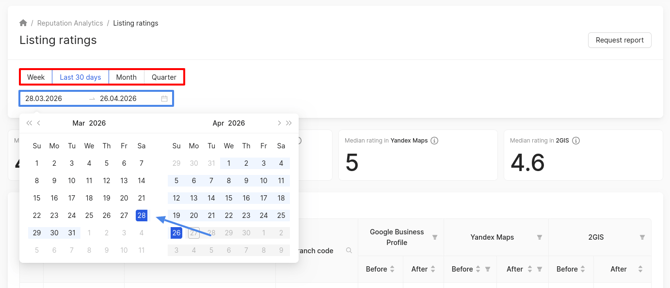
How to set a period for generating reports/charts?
All analytics on the page is provided based on the period set in the calendar:
- You can choose standard periods: week, 30 days, month, quarter.
- You can set a custom period by selecting dates in the calendar.
30 days filters data on the page for the last 30 days.
Month filters data for the last calendar month.
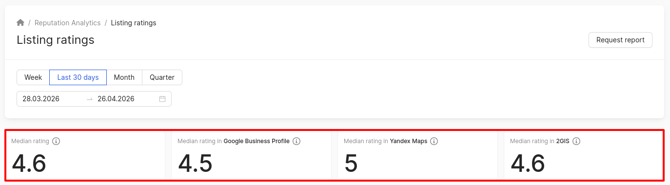
Ratings by catalogs
On this page, you can see the median company ratings calculated across 2GIS, Google, and Yandex catalogs as a whole, as well as separately for each of them.
How is the median rating calculated?- All ratings for the last year are taken, except for zero ratings (zero is simply not counted).
- The ratings are sorted in ascending order.
- If the number of ratings is odd (for example, 11), the median will be the rating that is exactly in the middle (for example, the sixth one).
- If the number of ratings is even (for example, 12), the median is half the sum of the two central ratings (in our example, the arithmetic mean of the fifth and sixth ratings).
Changes in ratings over a period
Information is provided in a convenient table listing all locations by 3 key platforms. The following data is available:
- Rating at the beginning of the period - Before column.
- Rating at the end of the period - After column.
- Change in rating over the period - After column.
To find the necessary location, use the search function in the table header.
How to go to the company's listing in the catalog?
To go to the company's listing in the catalog, click on any company rating on the desired platform.

How to filter companies by rating changes?
NOTE
Regularly monitor the changes in company ratings to understand:
- Which locations in the directories should be prioritized and improved.
- Which companies are leaders, and their metrics can serve as benchmarks for others.
To filter companies:
- Click on the filter icon.
- Select the criterion: rating dropped, rating increased, rating unchanged.
- Click OK.
Chart of rating dynamics over a period
The rating dynamics chart presents historical data on rating changes over the selected period set in the calendar (described above).
To see the chart for a location's rating, click on the “+” in the relevant row of the table. The chart will be displayed for all 3 platforms.
- The x-axis shows the dates for the selected period.
- The y-axis shows the rating value.

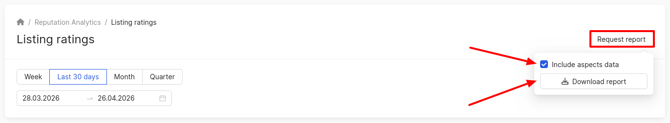
How to download the card rating report?
To export the card rating statistics, click on Request Report in the upper right corner of the section. If you want the report to include data on specific aspects, check the box. Then, click Download Report.
The requested report will be sent to you in .xlsx format to the email address specified in your profile.
If you have 5000 or more companies, the report will be sent to your email in .csv format.
- The NPS report is calculated without considering deleted reviews. You can learn more about NPS here.
- If there are no data in the NPS indicator fields (even though other data such as the number of reviews or ratings are present), it means that the NPS calculated to 0%.
A window will appear, in which, if necessary, to send the report to someone else besides you, you can enter additional email addresses in the Additional emails field, separated by commas. If there is no such need, leave the field blank. Then click Apply.
What data are available in the report?
Attention!
- The Good Place mark and Priority placement on Yandex are available from July 14, 2025, or from the moment of connecting to BrandWizard (when the company link appears). Historical data prior to this date will not be available.
- Ratings, the number of reviews, and scores are available from December 1, 2024, or from the moment of connecting to BrandWizard (when the company link appears). Historical data before this date will not be accessible.
The received report includes the following fields:
- Brand – the name of the brand in BrandWizard.
- Store code – the branch code in BrandWizard.
- City – the city where the company is located.
- Address – the company's address in BrandWizard.
- Legal entity — the legal name of your company.
- Company groups – a group created in the personal account that includes this location.
- Amount of ratings of Yandex (before, after) – change in the company's rating in the Yandex catalog over the selected period.
- Amount of reviews of Yandex (before, after) – change in the number of reviews left by clients on Yandex during the selected period.
- NPS of Yandex (before, after) – change in the NPS score in Yandex. You can learn what NPS is here.
- Link to Yandex – a link to the company in Yandex.
- Yandex actualization status (before, after) – change in Yandex update status over the selected period. More details can be found here.
- Yandex good place year (before, after) – change in the "Good Place" badge (whether it is displayed or not).
- Yandex priority placement (before, after) – change in the company's priority placement in Yandex (service purchased or not).
- Google rating (before, after) – change in the company's Google rating over the selected period.
- Amount of reviews of Google (before, after) – change in the number of reviews left by clients on Google during the period.
- NPS of Google (before, after) – change in the NPS score in Google. You can find out what NPS is here.
- Link to Google – a link to the company in Google.
- 2GIS (URBI) rating (before, after) – change in the company's rating in the 2GIS (URBI) directory over the selected period.
- Amount of ratings of 2GIS (URBI) (before, after) – change in the number of reviews left by clients in 2GIS (URBI) during the period.
- Amount of reviews of 2GIS (URBI) (before, after) – change in the number of reviews left by clients in 2GIS (URBI).
- NPS of 2GIS (URBI) (before, after) – change in the NPS score in 2GIS (URBI). You can learn what NPS is here.
- Link to 2GIS (URBI) – a link to the company in 2GIS (URBI).
- NPS total – the NPS indicator across all catalogs.
- Aspects from feedback — this field will only be displayed if, when requesting the report in the section, you checked the box Include aspects data. The field will present the aspects mentioned in the reviews. You can learn more about aspects here.
The following data is displayed in the report below:
- Overall average rating (before, after) – change in the average rating of reviews from Google, 2GIS, and Yandex catalogs.
- Average rating 2GIS (before, after) – change in the average rating of reviews from the 2GIS catalog.
- Average rating Google (before, after) – change in the average rating of reviews from the Google catalog.
- Average rating Yandex (before, after) – change in the average rating of reviews from the Yandex catalog.
- Overall median rating – median rating of reviews from Google, 2GIS, and Yandex catalogs.
- Median rating 2GIS – median rating of reviews from the 2GIS catalog.
- Median rating Google – median rating of reviews from the Google catalog.
- Median rating Yandex – median rating of reviews from the Yandex catalog.
Please note!
- The median rating is calculated for the last year.
- The average rating is calculated for the period selected in the section.
You can find out how the median rating is calculated here.
Yandex Rating: after, Google Rating: after, and 2GIS Rating: after fields will be color-coded to provide a clearer visualization of rating changes:
- Green - the rating has increased compared to the previous period.
- Red - the rating has decreased.
- Yellow - the rating remained unchanged.
- If the field is uncolored, there is no data on rating changes.
Aspects from feedback will also be color-coded to visually display the distribution of review sentiment across aspects. This will help identify which aspects are predominantly associated with negative or positive feedback, enabling timely measures for improvement or adjustment:
- Green — positive reviews predominate for these aspects.
- Red — negative reviews predominate.
- Yellow — reviews for these aspects have neutral sentiment.
- If the field is uncolored, the sentiment is undefined.
You can learn more about the Position Tracker further.