In this article, you will get acquainted with the following information:
- How to set filters for displaying charts and comparing data?
- What statistics are presented on the page?
- User actions in surveys
- How to download statistics by surveys?
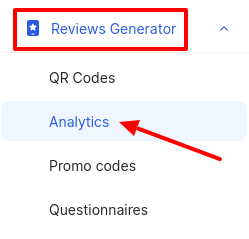
To navigate to the page, click on the Reviews Generator in the menu and select Analytics from the dropdown list.
Attention! The data in this section is presented from January 5, 2024.
How to set filters for displaying charts and comparing data?
First, select the survey for which you want to view the statistics.

Next, you can select the QR code for which you need to view the statistics.

All analytics on the page are provided depending on the period set in the calendar:
- You can select standard periods: week, 30 days, month, quarter.
- You can also set a custom period by selecting dates in the calendar.

You can specify the data display step: daily or weekly.
Attention! If the Week filter is selected or a period of less than a month is specified, the Week option will not be displayed.

What statistics are presented on the page?
In the first block, you can analyze the information described below. This data will be useful for assessing the effectiveness of surveys, user engagement, and satisfaction.
- Questionnaire opens - the number of times the survey was opened.
- Positive ratings - the number of positive ratings left in the survey.
- Negative ratings - the number of negative ratings left in the survey.
- Catalog visits - the number of clicks from the survey to main directories (Google, Yandex, 2GIS (URBI)) or via your link.
- Positive reviews - the number of positive reviews left.
- Negative reviews - the number of negative reviews left. Negative reviews are not published on maps; they are immediately collected in our personal account. You can view them in the Reviews section by selecting the Sources→Review Generator filter.
- Sent promo codes - the number of promo codes sent to clients for leaving reviews on platforms. You can find more about promo codes here.
Attention!- As of September 9, 2025, the promo code statistics have been reset, as previously, data was displayed for promo codes across all surveys. This meant that if a promo code was added to two or more surveys, selecting one survey in the filter would show data for the promo code across all surveys where it was used.
Now, the statistics are being collected again: when selecting a specific survey or QR code in the filter, the promo code information is displayed only for the selected item.
- As of September 9, 2025, the promo code statistics have been reset, as previously, data was displayed for promo codes across all surveys. This meant that if a promo code was added to two or more surveys, selecting one survey in the filter would show data for the promo code across all surveys where it was used.

User actions in surveys
The section showing the number of positive/negative reviews and ratings is divided into two charts. You can switch between them using the filter in the top right corner.
The blue line on the chart represents the number of survey openings. The columns display the number of reviews/ratings.
- The x-axis shows the days/weeks when actions were performed (openings, positive reviews/ratings, negative reviews/ratings).
- The y-axis indicates the number of these actions.
To view data for a specific day or week, hover your mouse cursor over the column in the chart.
Below the graph is a slider, which, when dragged left or right, will display data for all dates in the selected period.
The Transitions to Directories chart visually displays the number of transitions to directories (Google, Yandex, 2GIS(URBI)), as well as clicks on its own link.
How to download statistics by surveys?
To export statistics by surveys, click on Download data in the upper right corner of the section.

A window will appear, in which, if necessary, to send the report to someone else besides you, you can enter additional email addresses in the Additional emails field, separated by commas. If there is no such need, leave the field blank. Then click Apply.
The report contains 2 sheets with the following data:
Sheet 1 (Surveys):
- Questionnaire ID – the identifier of the survey in BrandWizard.
- Questionnaire name – the name of the survey in BrandWizard.
- Transitions – the number of times the survey was opened by users.
- Positive reactions – the number of positive ratings left.
- Negative reactions – the number of negative ratings left.
- Go Yandex - the number of transitions from the survey to the Yandex catalog.
- Go Double Gis - the number of transitions from the survey to the 2GIS catalog.
- Go Google - the number of transitions from the survey to the Google catalog.
- Go Link - the number of transitions from the survey via their own link.
- Go to catalog - the total number of all transitions.
- Positive reviews - the number of positive reviews left and published in the catalogs.
- Bad review – the number of negative reviews left.
- Sent Promo Codes – the number of promo codes sent.
- Scale - type of rating scale: 10-point, 5-point, and Like/Dislike (in this case, the field will contain the number 2).
- Rating N - the rating left by the user:
- For the 10-point scale, if the company did not receive any rating from 1 to 10, the fields will display 0.
- For the 5-point scale, fields with ratings from 6 to 10 will be marked with dashes. If the company did not receive any rating from 1 to 5, these fields will contain 0.
- For the Like/Dislike scale, ratings of 1 and 10 will be assigned (1 for dislike, 10 for like). Other ratings will be marked with dashes. If the company did not receive ratings of 1 or 10, these fields will show 0.
Sheet 2 (QR Codes):
- QR Set – the name of the QR set.
- Company code – the branch code of the company in BrandWizard.
- Company address – the company’s address in BrandWizard.
- Clicks on QR – the total number of transitions via the QR code.
- Positive – the number of positive ratings left.
- Negative – the number of negative ratings left.
- All QR reviews – the total number of reviews left by users after scanning the QR code.
- Go Yandex - the number of transitions from the survey to the Yandex catalog.
- Go Double Gis - the number of transitions from the survey to the 2GIS catalog.
- Go Google - the number of transitions from the survey to the Google catalog.
- Go Link - the number of transitions from the survey via their own link.
- Go to catalog - the total number of all transitions.
- Positive reviews - the number of positive reviews left and published in the catalogs.
- Bad reviews – the number of negative reviews left.
- Sent Promo Codes – the number of promo codes sent to users after interacting with the QR code.
- Average rating – the average rating for the QR code, calculated based on all received ratings.
- Comment - when the rating scale is changed, the rating data will be displayed for the entire period. In this case, you will see the following notification in this field: The rating scale was changed in the survey settings, so the rating data is displayed for the entire period. If the rating scale has not been changed, this field will remain empty.
- Scale - type of rating scale: 10-point, 5-point, and Like/Dislike (in this case, the field will contain the number 2).
- Rating N - the rating left by the user:
- For the 10-point scale, if the company did not receive any rating from 1 to 10, the fields will display 0.
- For the 5-point scale, fields with ratings from 6 to 10 will be marked with dashes. If the company did not receive any rating from 1 to 5, these fields will contain 0.
- For the Like/Dislike scale, ratings of 1 and 10 will be assigned (1 for dislike, 10 for like). Other ratings will be marked with dashes. If the company did not receive ratings of 1 or 10, these fields will show 0.

You can find out about the Promo codes page further.