In this article, you will get acquainted with the following information:
- How to select sources and set a period for displaying data?
- Chart of the distribution of photos and videos by days for the selected period and statistics broken down by catalogs.
- Views and appeals of materials
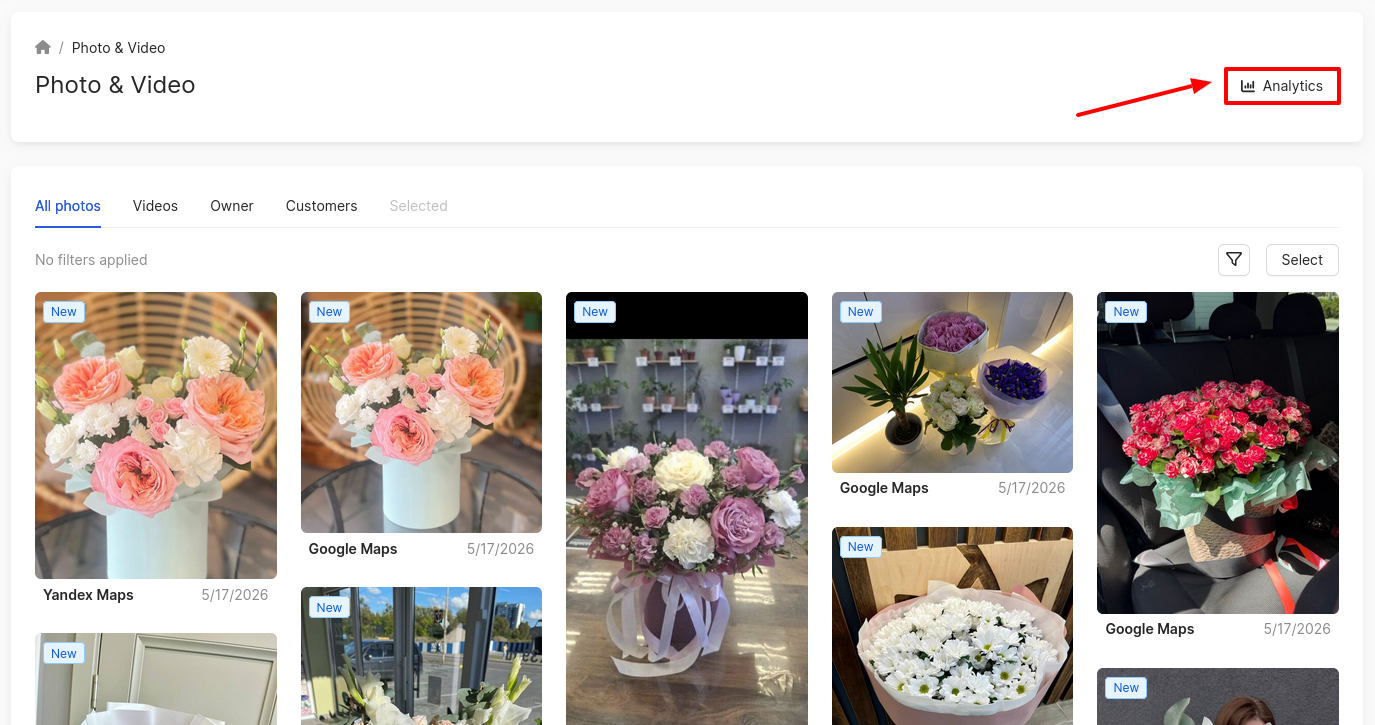
To view analytics for photos and videos, click on Analytics in the upper right corner of the section.
How to select sources and set a period for displaying data?
You can view analytics on the page for a specific source and for the required period. To do this, click on the filter icon.

- In the Sources field, select the catalogs for which you need photo and video analytics: 2GIS, Google Maps, Yandex Maps.
- In the Date range field, select the dates.
- Click Apply.
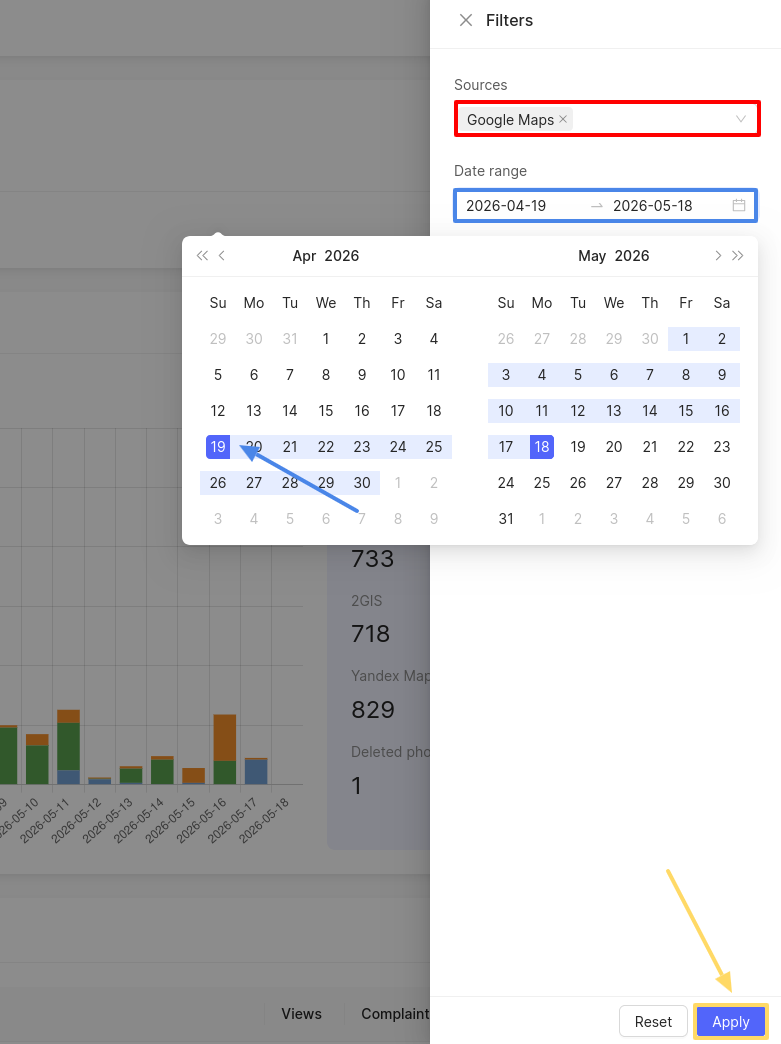
Chart of the distribution of photos and videos by days for the selected period and statistics broken down by catalogs
The statistics for photos and videos are divided into two tabs.
The chart of photo/video distribution represents historical data on the changes in photos/videos for the selected period set in the calendar.
- The x-axis displays the dates for the selected period.
- The y-axis shows the number of uploaded photos/videos broken down by catalogs: Yandex Maps, 2GIS, Google Maps, as well as separately displayed in red are deleted materials.
To the right of the chart, there are statistics on uploaded photos/videos for the entire selected period broken down by catalogs.
Views and appeals of materials
This section presents statistics on interacting with photos and videos in the personal account broken down by catalogs. You can see the number of views, submitted complaints, the number of materials to be deleted, and those that have already been deleted.
Click on Download report to receive this statistics in xlsx format. The report will be sent to the email specified in your personal account.
A window will appear, in which, if necessary, to send the report to someone else besides you, you can enter additional email addresses in the Additional emails field, separated by commas. If there is no such need, leave the field blank. Then click Apply.
You can find out about the Online Presence Analytics page further.