In this article, you will learn the following information:
The Conversations Report provides an overview of all your conversations for a selected period of time. With this report, you can obtain important metrics about the state of your conversations, such as message volume, first response time, resolution time, number of resolved conversations, and more.
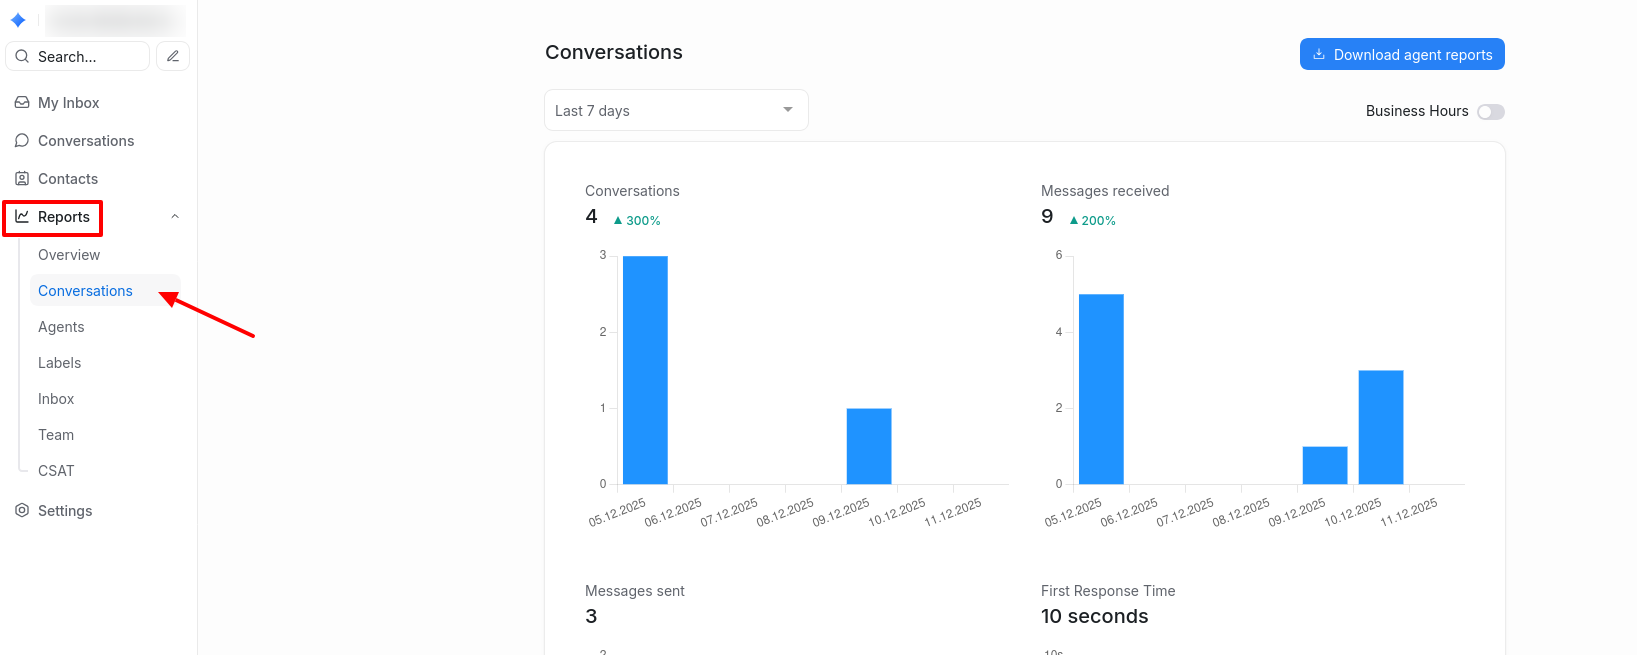
To access the report, go to Reports → Conversations.
How to filter the report?
The data on the page is displayed depending on the selected period:
- Last 7 days.
- Last 30 days.
- Last 3 months.
- Last 6 months.
- Last year.
- Custom date range.
After selecting a period, you can choose how to group the data. Each period has its own set of available groupings. See the table below for details:
| Period | Grouping Options |
|---|---|
| Last 7 days | Day |
| Last 30 days | Day, Week |
| Last 3 months | Day, Week, Month |
| Last 6 months | Week, Month |
| Last year | Week, Month |
| Custom date range | Day, Week, Month, Year |
When selecting the Custom date range period, a calendar will appear where you can choose the required dates.
Enable the toggle in the upper-right corner of the screen to adjust report metrics for working hours.
If the Business Hours option is enabled for a channel, the report data will be calculated based on working hours. You can set working hours in the channel settings by going to Settings → Inboxes, then clicking the edit button (pencil icon) for the selected channel.
Conversation metrics
Conversations
This chart shows the total number of conversations received during the selected period. Only conversations created within the chosen period are counted. If a conversation was reopened from a previous period, it is not included. Conversation Traffic in the Overview report allows for deeper analysis of created conversations.
If data is grouped by days, the chart will show the total number of conversations received each day during the selected period.
Hovering over a point on the chart displays the exact number of conversations that occurred on that day/week/month.
Messages received
The number of messages received from all channels during the selected period.
Messages sent
The number of messages sent from Multichat during the selected period. This includes messages from both bots and agents.
First response time
The average time agents take to respond to the first message within conversations created during the selected period.
Hovering over a point on the chart shows the exact average response time and the number of conversations used for calculation on that day/week/month.
Resolution time
This chart shows the average time required to resolve a specific client conversation. Resolution time is calculated as the difference between the time the conversation was opened and the time it was closed.
Attention! Reopened conversations are considered the same conversation, so resolution time increases if the conversation was reopened and closed again.
Hovering over a point on the chart shows the exact average resolution time and the number of chats used for calculation on that day/week/month.
Resolution count
The number of conversations that were completed on a given day within the selected period.
Customer waiting time
The time clients had to wait for a response from an agent. Similar to first response time, but calculated across all outgoing message traffic. The higher the number, the slower the team’s reaction to individual messages.
Hovering over a point on the chart shows the average waiting time for that day/week/month, calculated based on the number of responses received.